China Auto Export Value Reaches USD 169.6 Billion: Four Statistical Lenses Exporters Must Separate
On 20 November 2026, CPCA secretary general Cui Dongshu cited customs data showing China's finished-vehicle export value at USD 169.6 billion in January-October, up 52% year on year, and about USD 19.7 billion in October, up 38%. Auto parts contributed a separate USD 88.7 billion, up 12%, including about USD 9.2 billion in October, up 32%. CAAM counted 9.271 million vehicle exports in January-October, up 65.1%, and 1.066 million in October, up 60.2%. Separately reported customs volumes were 9.736 million for January-October, up 49.6%, and 1.108 million in October. The customs and CAAM unit series use different scopes and cannot be combined; dollar value is not sales volume, finished vehicles are not parts, and used-car exports are outside these new/finished-vehicle statistics.

What Happened
On 20 November 2026, Cui Dongshu, secretary general of the China Passenger Car Association (CPCA), cited General Administration of Customs data in a new reading of China's vehicle trade. The headline figure is the USD 169.6 billion export value of finished vehicles in January-October 2026, 52% higher year on year. October alone accounted for approximately USD 19.7 billion, up 38% year on year.
The same reporting placed auto-parts export value in a separate category. Parts generated USD 88.7 billion in January-October, up 12%, and approximately USD 9.2 billion in October, up 32%. These are substantial trade flows, but they are not additional vehicle exports and must not be added to the finished-vehicle total to describe a number of cars.
Volume figures arrive through two distinct statistical lenses. The China Association of Automobile Manufacturers (CAAM) reported 9.271 million vehicle exports in January-October, up 65.1%, and 1.066 million in October, up 60.2%. Separately reported customs data put October at 1.108 million vehicles and January-October at 9.736 million, with the ten-month figure up 49.6%.
These are reported historical figures for the stated periods. They are not a forecast, a target or a new policy announcement. The distinction matters because the data can inform operational questions without being turned into an unsupported claim about future export volumes.
Data and Statistical Scope
The cleanest way to read the release is to keep four questions separate: how much finished-vehicle export value was recorded, how much parts export value was recorded, how many vehicles CAAM counted, and how many vehicles customs counted.
| Measure | January-October 2026 | October 2026 | Statistical lens |
|---|---|---|---|
| Finished-vehicle export value | USD 169.6bn, +52% YoY | about USD 19.7bn, +38% YoY | Customs data cited by CPCA's Cui Dongshu |
| Auto-parts export value | USD 88.7bn, +12% YoY | about USD 9.2bn, +32% YoY | Separate customs category; not finished vehicles |
| Vehicle export volume | 9.271m, +65.1% YoY | 1.066m, +60.2% YoY | CAAM series |
| Vehicle export volume | 9.736m, +49.6% YoY | 1.108m | Separately reported customs series |
Customs volume and CAAM volume cannot be mixed. They should not be added, netted or used interchangeably in a growth calculation. Their collection channels and statistical treatment differ, so the fact that both are labelled vehicle exports does not make them interchangeable observations. This article therefore presents them side by side without choosing one to replace the other and without calculating a gap as though it were an adjustment.
Dollar value is not sales volume. The USD 169.6 billion figure measures export value, while 9.271 million and 9.736 million measure vehicle counts under their respective systems. A value series can move differently from a unit series because of product mix and other composition effects. It would be wrong to divide the finished-vehicle value by the CAAM count, or by the customs count, and present the result as an official average. No such calculation is made here.
Finished vehicles are not auto parts. Engines, components and other parts belong to a separate trade category. The parts figures cannot be used to infer a number of exported vehicles, and the vehicle figures cannot be treated as including parts revenue. Combining the two value lines may describe a deliberately defined broader trade basket, but it does not produce a finished-vehicle export value.
Used-car exports are not included in these new/finished-vehicle statistics. None of the four rows is a used-car export total. Exporters should not apply the CAAM or customs growth rates to their own used-vehicle shipments, nor describe the headline values as evidence of used-car demand. Separate used-car documentation and destination-market evidence remain necessary.
Implications for Used-Car Exporters
The practical lesson is analytical discipline rather than a direct volume signal. Strong finished-vehicle export data confirms the scale of China's automotive trade, but it does not provide a ready-made denominator for the used-car business.
First, keep market context separate from shipment records. An exporter may use the figures to explain why automotive logistics, compliance and overseas distribution are prominent topics. Internal performance should still be measured from actual used-car export declarations, vehicle identification records and destination documentation. A national new/finished-vehicle series cannot substitute for that evidence.
Second, label every dashboard field by source and unit. A dashboard that places USD value, CAAM units, customs units and parts value in one unlabelled sequence invites false comparisons. Record the source, period, currency or unit, year-on-year basis and vehicle category beside each figure. If a chart combines January-October with October, make the different time windows explicit.
Third, do not infer used-car demand from parts growth. Parts exports can reflect maintenance and supply-chain activity, but the reported USD 88.7 billion does not identify how much relates to Chinese used vehicles abroad. It offers no model-level or country-level used-car conclusion without additional data.
Fourth, treat logistics planning as a separate verification task. High national vehicle-export activity may coincide with demand for port handling, shipping space and documentation capacity, but the figures do not establish conditions on a particular route. Exporters should confirm current carrier schedules, booking requirements and destination procedures directly rather than converting national growth into a route-level assumption.
Fifth, keep scenarios clearly labelled. Businesses can test how they would respond to different shipping lead times or documentation workloads, but those are internal scenarios, not official forecasts. The sources reviewed here report January-October and October outcomes; they do not announce a future quota, guaranteed growth rate or regulatory change for used-car exporters.
Method and Sources
This article is a source reconciliation, not an independent customs calculation. Its primary value chain is General Administration of Customs data cited by CPCA's Cui Dongshu on 20 November 2026, reported by [Sina Finance](https://finance.sina.com.cn/7x24/2026-11-20/doc-iniziafz0754992.shtml). [Stockstar](http://finance.stockstar.com/IG2026112000006330.shtml) provides a same-day cross-reference. These are secondary reports of customs data; this article does not claim to have located or examined an original customs detailed-data page.
The CAAM figures are kept under the CAAM label rather than merged with customs volumes. The separately reported customs October volume of 1.108 million and January-October volume of 9.736 million, including the 49.6% year-on-year increase, are cross-checked against [National Business Daily, 10 November 2026](https://m.nbd.com.cn/articles/2026-11-10/4643427.html). The later 20 November reports supply the value and parts context through Cui Dongshu's citation.
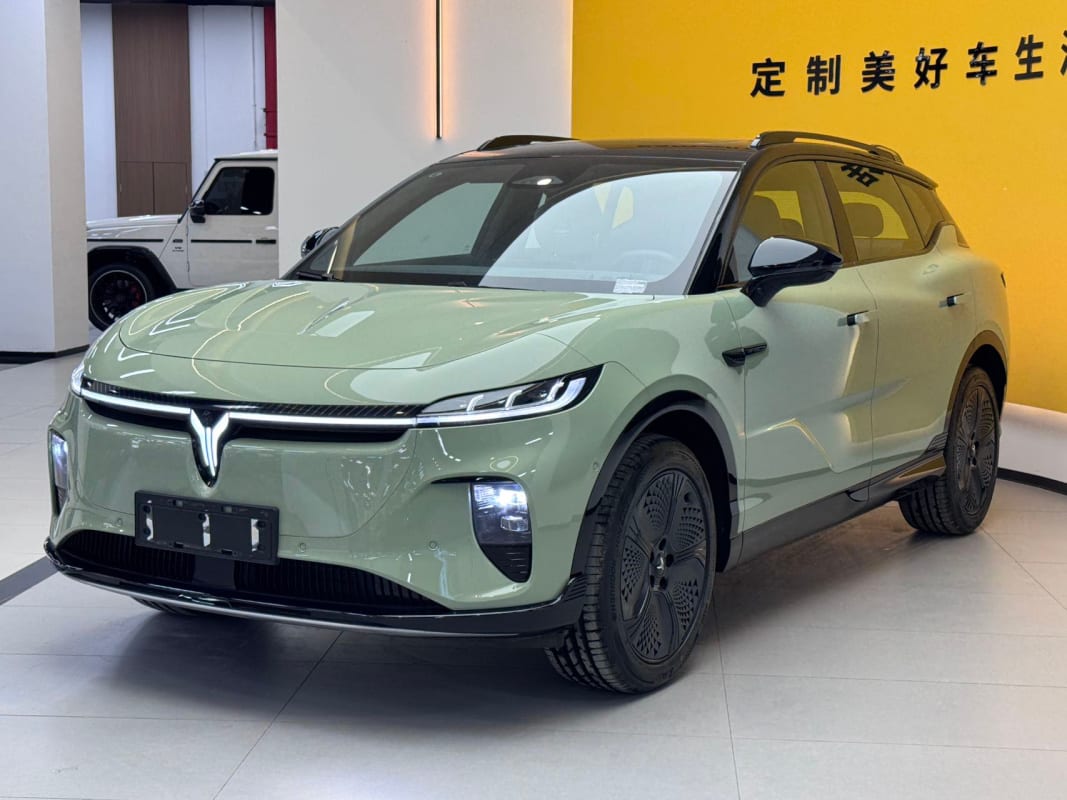
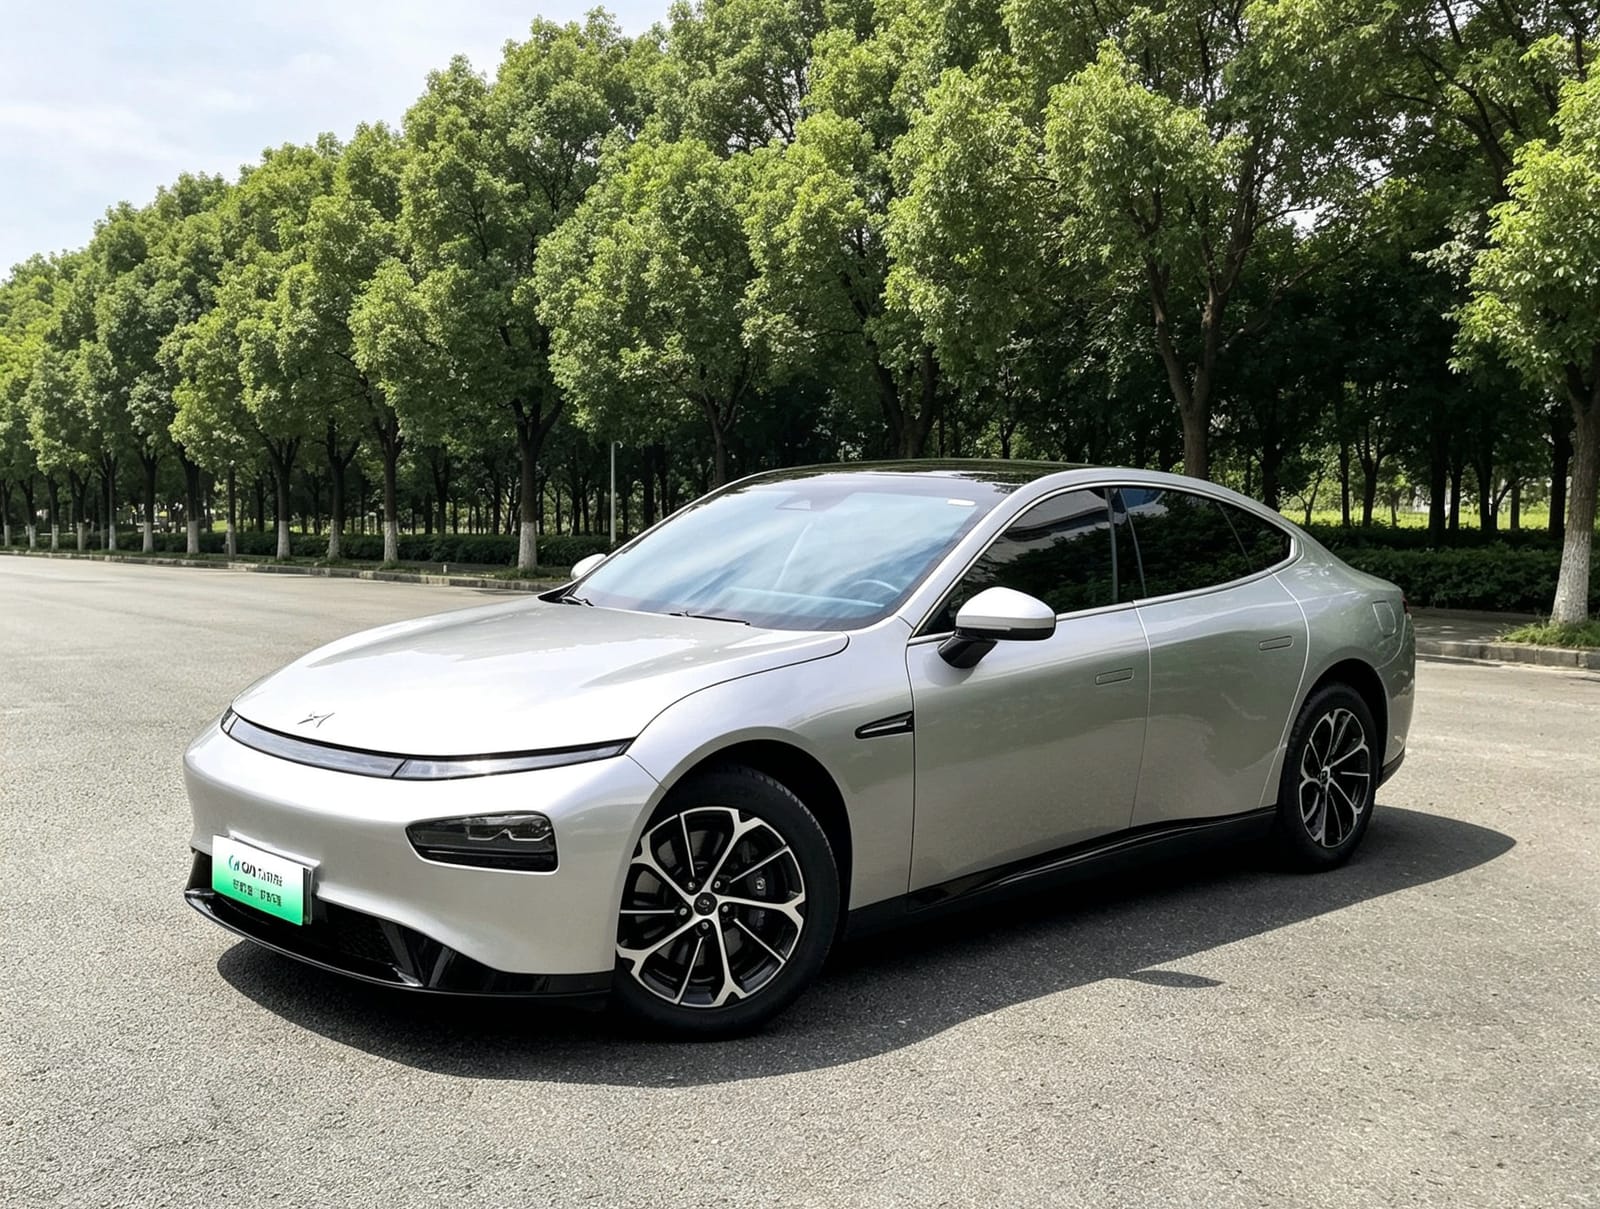
All percentages are reproduced as year-on-year changes for the periods stated. October and January-October are not interchangeable. Rounded October value figures remain approximate. No average export value, combined vehicle-and-parts total, forecast or used-car growth estimate has been derived. The two vehicle photographs are illustrative real vehicle photos, not evidence of the trade flows described.